!NEW! CLICK HERE TO BUY FOR ONE TEAM – ONE MONTH HUMANIZING BOOST!
Help your team’s performance and wellbeing and prevent burnout today!
FOR ENTERPRISE SALES ASK US FOR A DEMO HERE
The People Not Tech Team Dashboard is an application that helps teams of all sizes to improve innovation, performance and well-being by increasing their Psychological Safety and bettering their team behaviours through a continuous process of self-improvement.
Team improvement, while cardinally important to the enterprise, does not happen overnight. There is no quick-fix. It develops through intentional actions, which drive incremental changes. But the good news is that this can be undertaken autonomously at the team level, once they are kitted with enough data and know-how. This is accomplished in much the same way as we can improve the behaviour of individuals through techniques such as Cognitive Behavioural Therapy.
We know that all teams are different, and have varied ways of working. And so we have developed our application to be as simple and engaging to use as possible, while offering deep insight into the team dynamic.
ASK US FOR A DEMO HERE

The Improvement Cycle
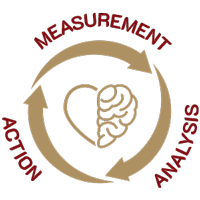
Our solution works in an iterative manner – a repeatable cycle of intuitive steps, which guide teams towards self-improvement through more open and psychologically safe communication.
-
Measurement
Team members respond to a randomised selection of prompting questions.

Questions interface

The questions are carefully constructed to elicit a meaningful response and are based on Prof. Dr. Amy Edmondson’s initial Psychological Safety questionnaire, the Spotify Health Check, and Google’s Project Aristotle questions set – which have been further developed based on our research.


Unlike surveys and snapshots, our Team Dashboard evaluates team member interactions both quantitatively (by aggregating the answers to each question) and qualitatively (through behaviour-driven events).
Our proprietary algorithm then maps the responses to the core aspects of Psychological Safety:
The positive behaviours
- Courage
- levels of bravery and vulnerability as perceived individually
- Flexibility
- appetite for change and overall ability to adapt
- Engagement
- emotional investment and connection with the team
- Learning
- curiosity and the intentional collective acquisition of new insight and skill
- Openness
- willingness to speak up without negative consequence and avoid impression management as a team
- Resilience
- ability to sustain perceived hardship and remain stable and strong without loss of enthusiasm
The Negative Behaviours
- Impression Management
- The “dark side” of Psychological Safety consists of an avoiding, fear-based behaviour where team members do not speak up because they are afraid of looking incompetent, ignorant, disruptive or negative
In addition to our default Psychological Safety prompts, other question packs are available:
- Aristotle pack
- Remote Working pack
These questions are mixed seamlessly into the default questions and provide the team with additional data.
-
Analysis
The team reviews the dashboard and agrees upon the areas to improve on.

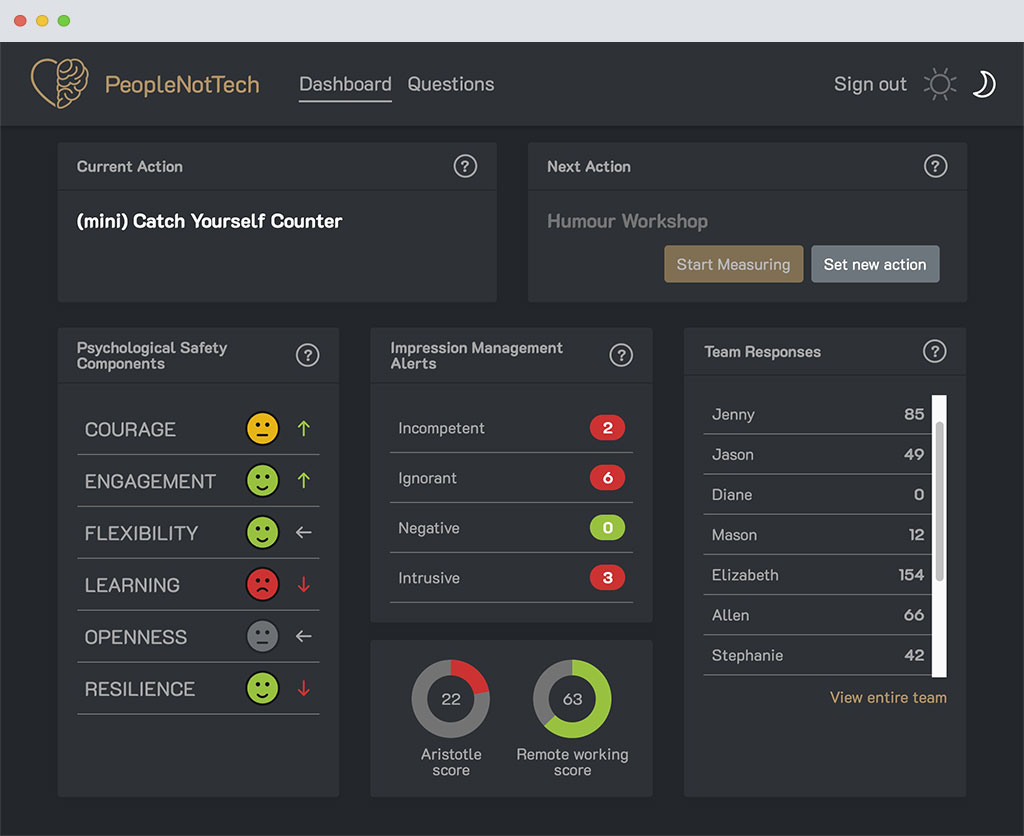
Dashboard (dark mode) The Dashboard displays the team’s current status in a number of areas:
Psychological Safety Components
Each of the six primary components of Psychological Safety has an associated score. This is then translated to an easily understood graphic to convey a positive, neutral, or negative rating.
Additionally, each rating is accompanied by an arrow icon to indicate the team’s trend compared to scores from the previous action.
Impression Management Alerts
Alerts anonymously whenever a response is given to indicate that team members are Impression Managing.
Google’s Aristotle Score
The score is calculated by asking the team some of the same questions Google used in Project Aristotle and finding out how they feel the organisation and the team are doing regarding Dependability, Structure and Clarity, Purpose, Impact, Belonging and Organisational Health.
Team’s Participation
Counts the number of responses each team member has given, to encourage engagement and accountability, and to reaffirm the presence of a safe space by only displaying the number of questions not their answers.
-
Action
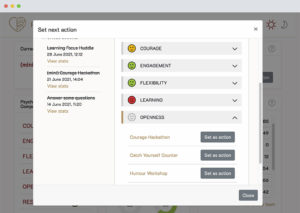
Using the dashboard analysis, the team agrees upon their next action and undertakes it by using the Team Actions described in detail in the playbook that are self-facilitated by the team themselves.

Playbook 
Example play After reviewing the dashboard, -typically in the retro but weekly meetings work too!-, the team should ask themselves “What is the number one thing we could focus on next to be a better team?”. They will then collectively decide on the next action they will take. For example, suppose the dashboard shows dropping levels in Openness and Resilience. The team may decide that they want to prioritise increasing their Openness score. They will then decide on an action which addresses this. Teams can create their own custom actions, or they can choose one of the proven actions from our Playbook.
The Playbook
Our Team Solution includes the Playbook — a number of tried-and-tested activities, carefully tailored to tackle specific aspects of Psychological Safety.
These plays vary in length from 3 hours to 20 minutes to cater to all time constraints of even the most busy of teams, but are designed to be fun and engaging.
Each Play is designed to address one or more of the core indicators that lead to increased Psychological Safety within the team. The activity is described in detail, with step-by-step instructions, and includes suggested resources and tips for next steps.
Once the next action has been agreed on and done by the team, they will click on “Start Measuring” to reset all dashboard data so they can see the effects of the last action they have engaged in. They will then use the new data to decide on the next action and so on…
Additional features
- Rewards to increase desirable behaviours such as Speaking Up
- Access to Coaches
- Further Learning & Development Resources